


In my previous post, I explained how to install NMIS8 in centos machine.
By following NMIS series, In this post i going explain how to configure NMIS to mointor your environment.
Here we go…
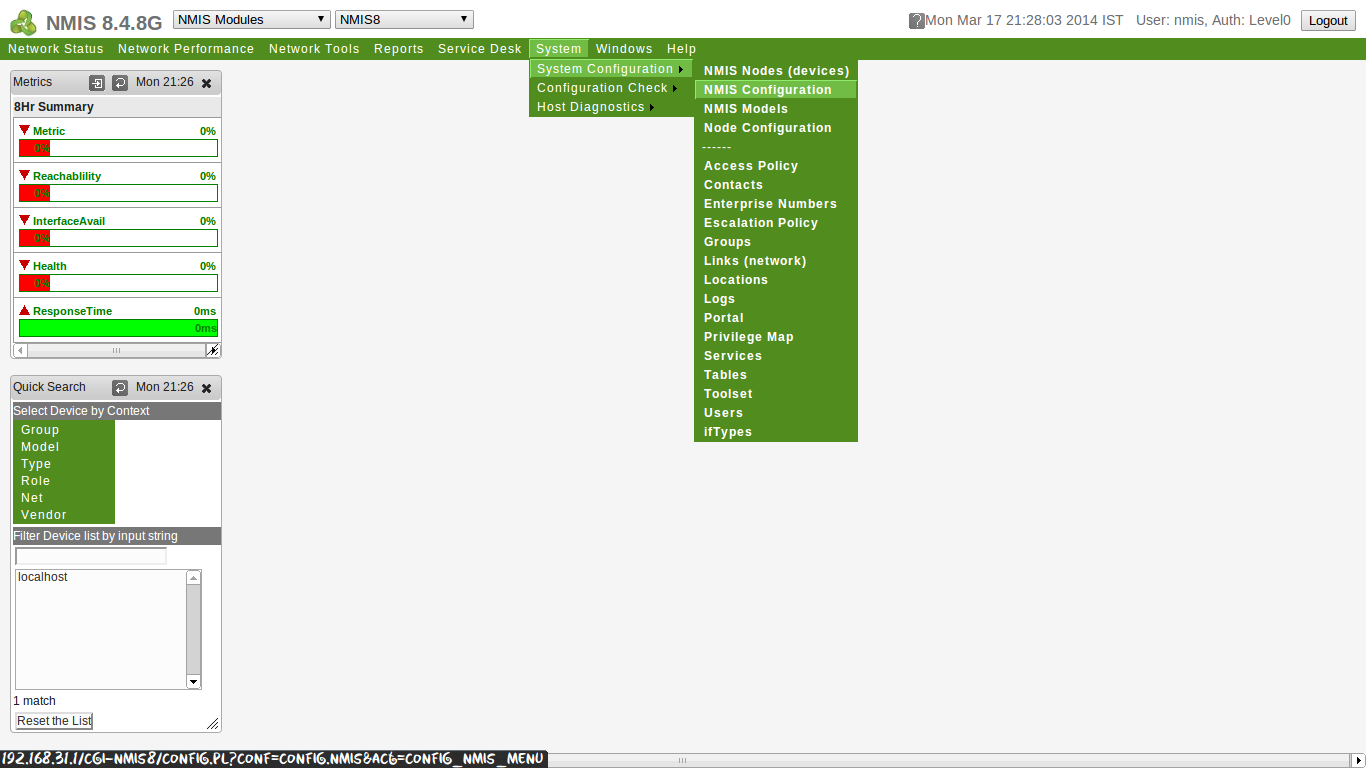
NMIS’ configuration is stored in text files in /usr/local/nmis8/conf/ and can be edited by hand. However, it is highly recommended to use the built in tools to edit the configuration. The main configuration can be found under Configuration > System > NMIS Configuration.
System > System Configuration> NMIS Configuration
Clicking on NMIS Configuration brings up the NMIS config window show in the top left of the next picture. From there you can choose one of the various NMIS configuration sections. To start go to system.
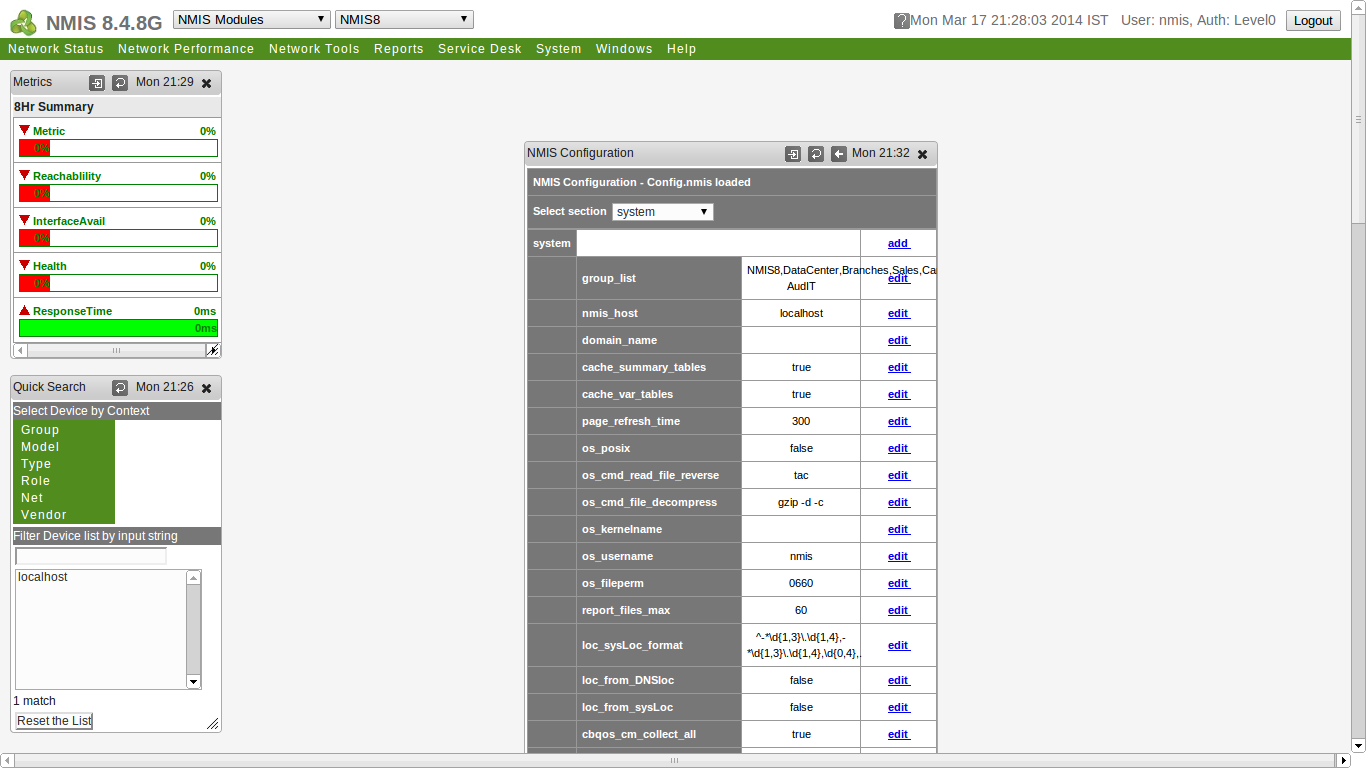
The system configuration section has the basic configuration for the NMIS software. These include the name of the NMIS server, NMIS groups, Linux user and group to run NMIS as and the file permissions. Most of these can be left at the default, but unless you have very few nodes to monitor, you will want to setup groups.
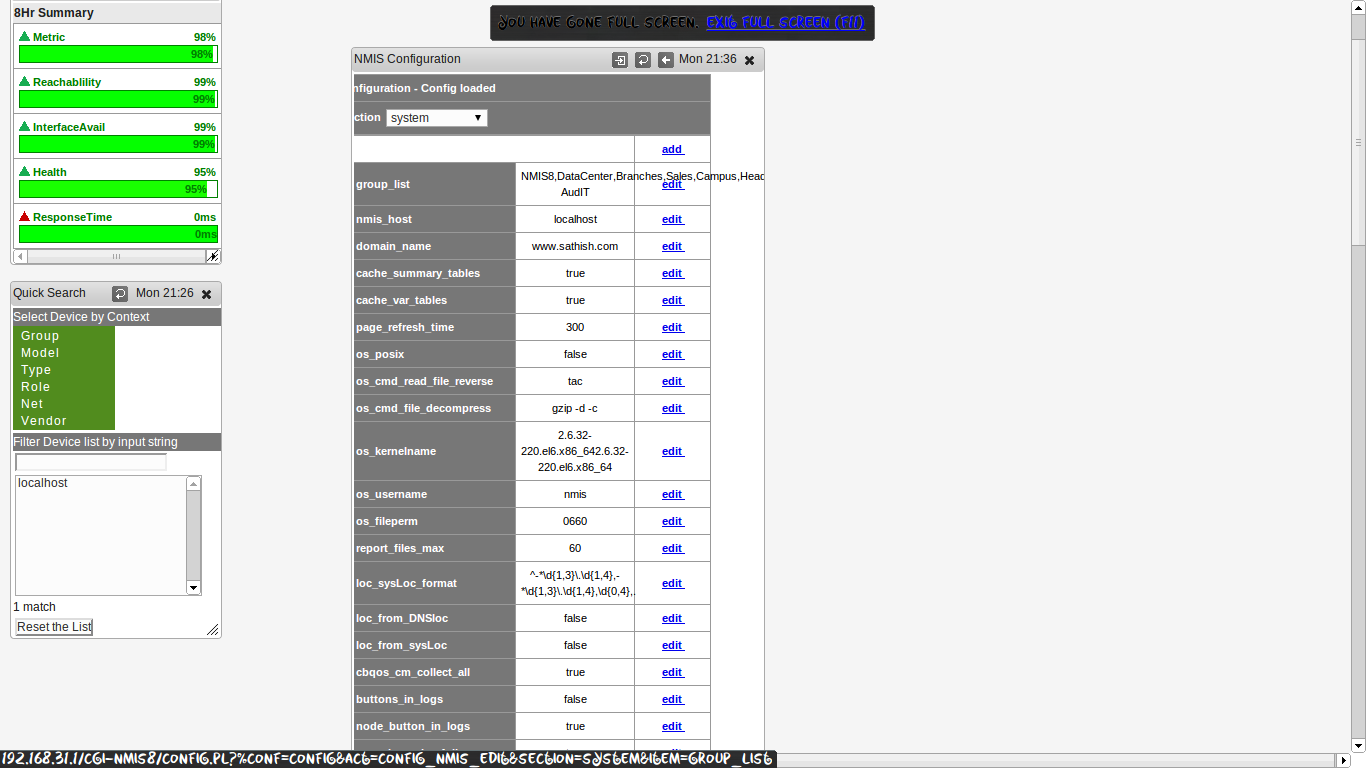
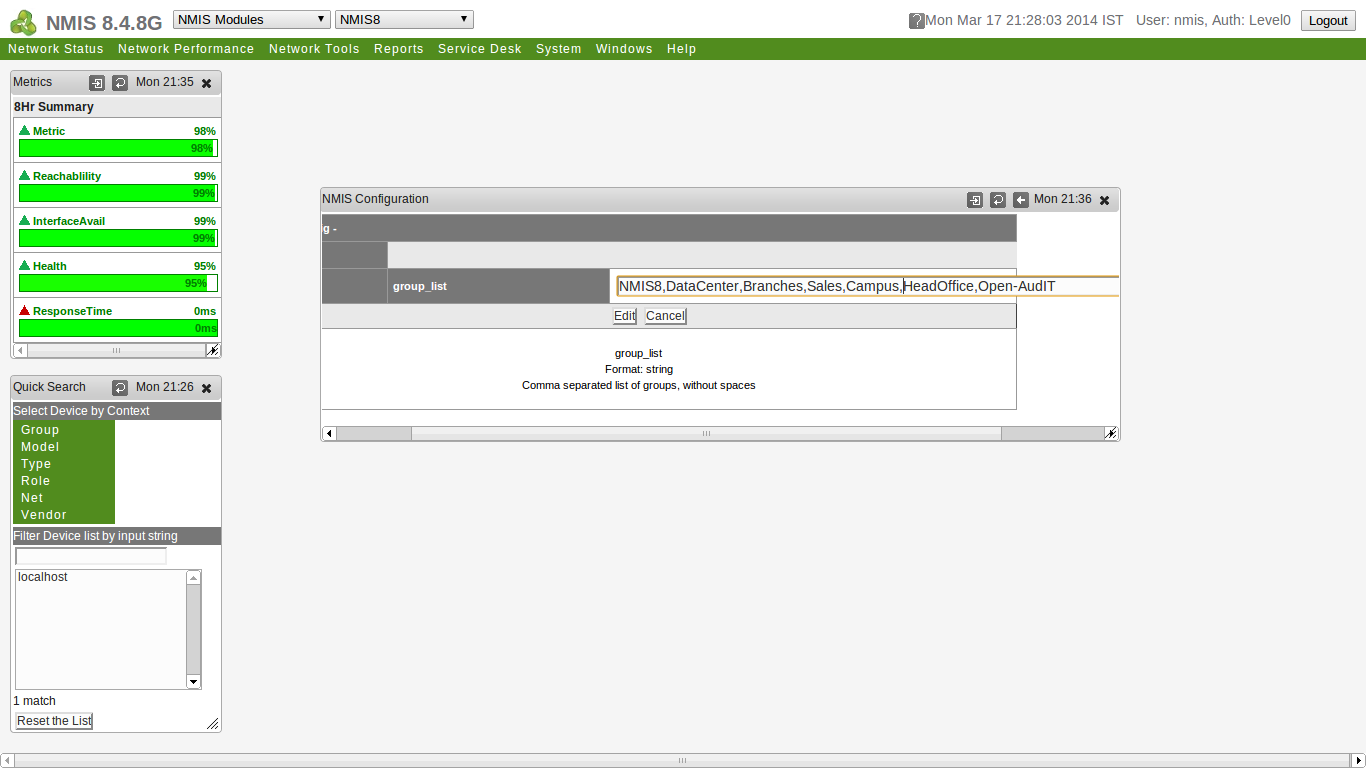
To setup groups, click on edit next to the current Groups variable. This will bring up another window where you can make a comma delimited list of groups. Please note, don’t put spaces as they can get confusing if you ever have to edit the configuration by hand.
E-mail Configuration
The next section to setup is the e-mail section. Just like the system section it is found in the NMIS config window. Here you will setup your mail server, mail domain, the address NMIS will send mail as and whether or not to combine e-mail alerts. For example if you have three nodes down at the same time, it will send one e-mail instead of three separate ones. Just like changing the Groups, click edit to change a variable.

Escalation Timing Configuration
Next we need to tell NMIS what the elapsed event time will be before NMIS alerts someone. This is referred to as escalation. Once again the escalation section is found in the NMIS config window. Each level is listed as the number of seconds elapsed. For example, the default scale sends the first notification at Level 0 which would be 5 minutes. Escalation combined with Contacts provides a powerful notification mechanism for events.

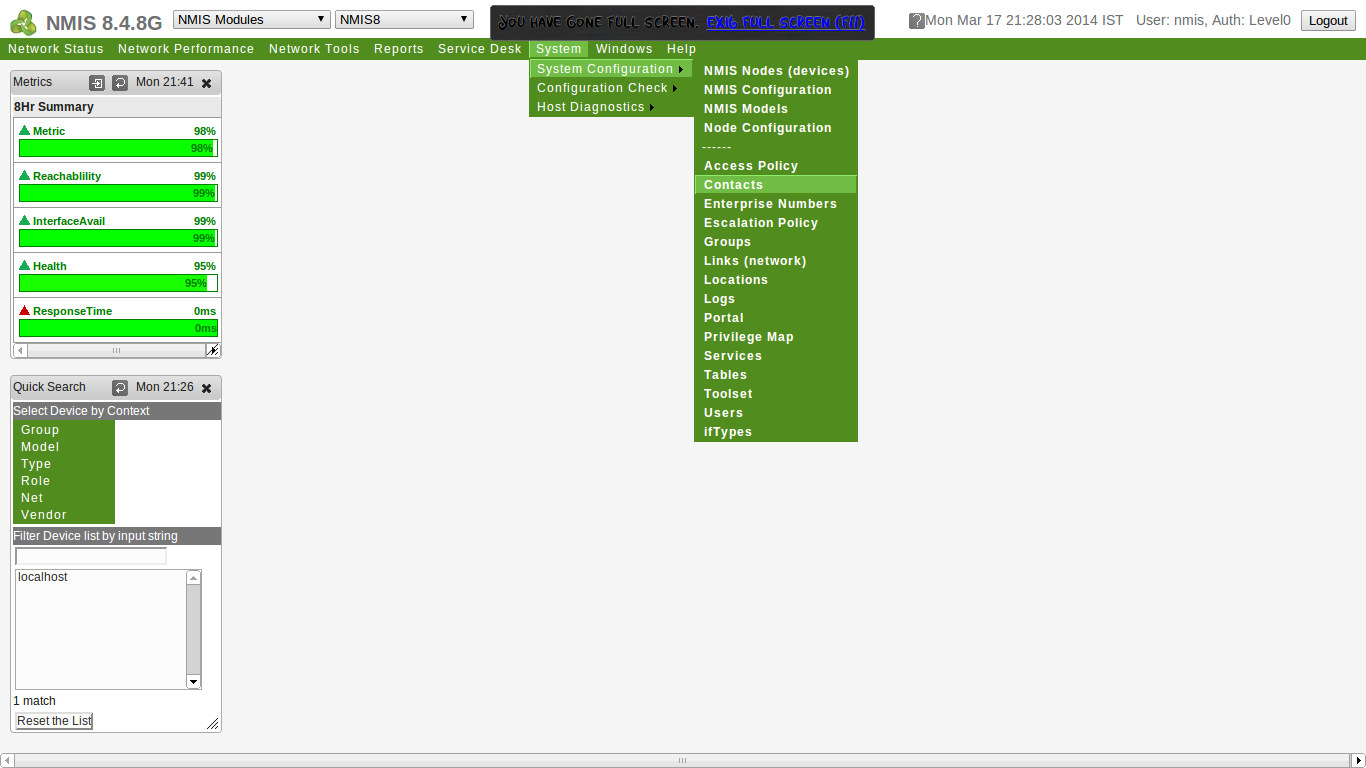
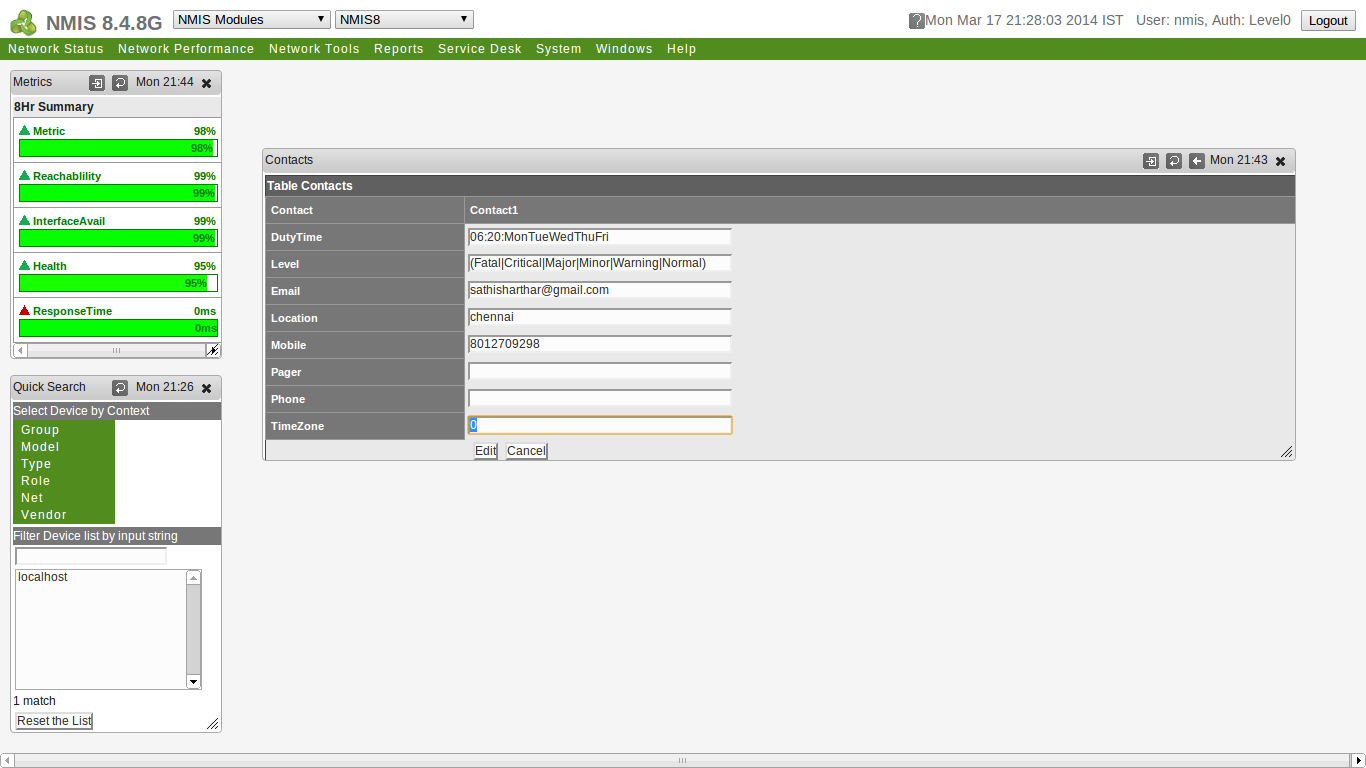
Contact Edit Screen
The Contacts configuration is managed by going to System> System Configuration>Contacts. Each contact is defined by a Contact name (spaces seem to cause issues at times). Within each contact are several bits of information. The Duty Time defines when the contact will receive notifications. The example below shows a contact that is available 24x7x365, but depending on your needs you can have different contacts be active at different times. If you are going to use the duty time, make sure to set the Time Zone offset from GMT. In my use of NMIS I have only used the e-mail field, but it does support paging via SNPP and SMS through a SMS gateway.
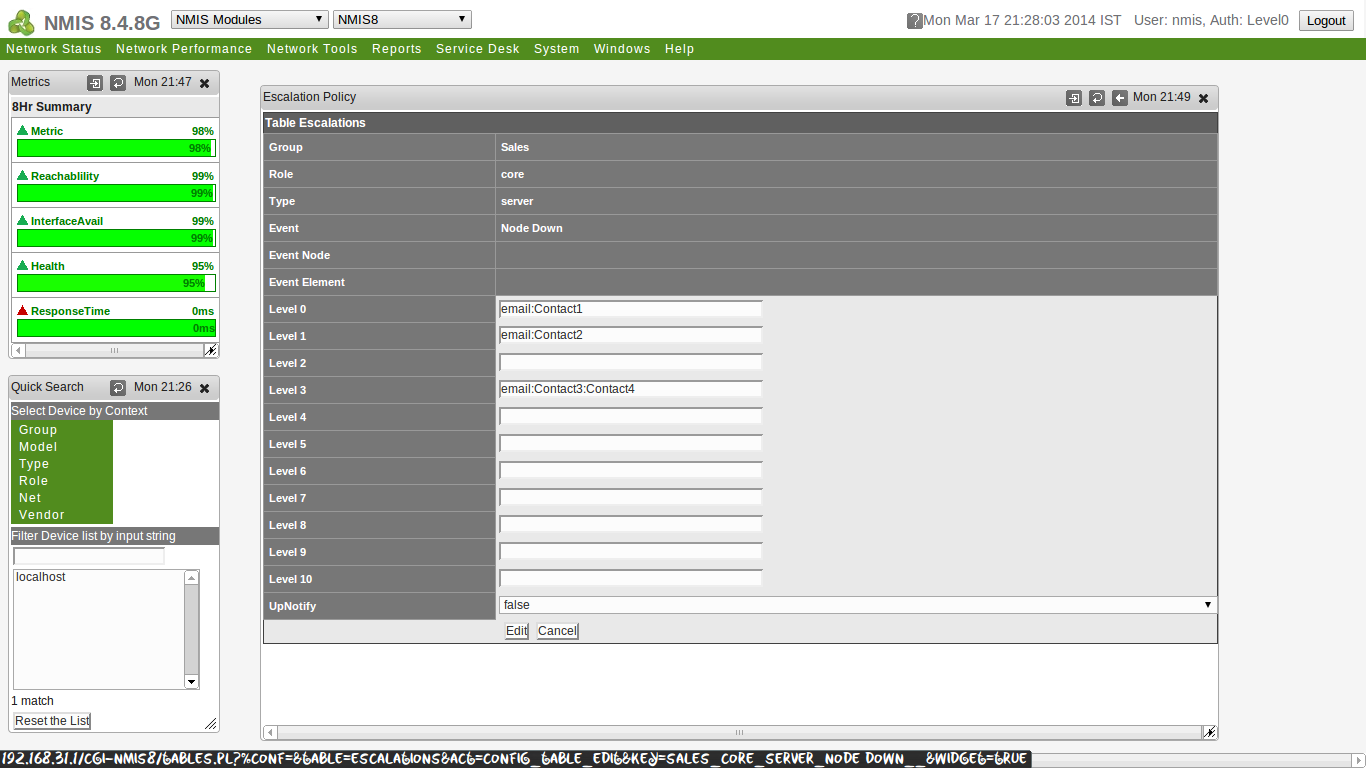
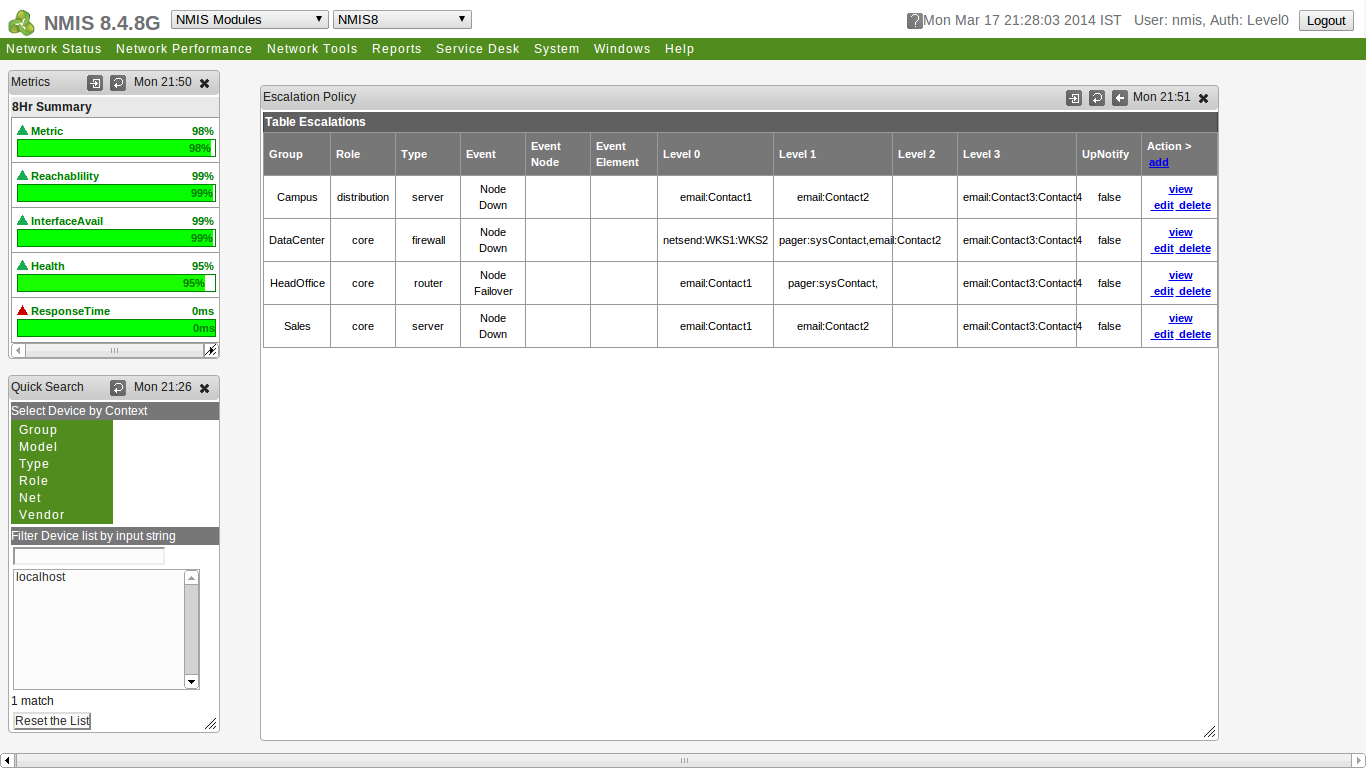
Escalation List
Each line in the Escalation table defines an escalation policy. To change the notifications associated with a particular policy, choose edit. This will bring up another dialog box. Each policy can apply to all groups (default) and roles (default) or they can be honed to only apply to a certain group or role or combination of a group and role. For example, you may want a certain escalation policy for all devices in your Datacenter group that are classified as being in a Core role. The type can further hone the policy to a device type such as router, switch or server. The Event variable establishes for which event type or all event types (default) that the policy will be active. If you need further granularity, you can type in a specific node name and/or element (interface).
Now that the policy of what to notify on is defined, the who and when need to be defined. The levels correspond to the levels in the escalation table. As shown below, the action for each level is defined as type colon and then the Contact name. For multiple Contacts, separate them with colons. Finally the UpNotify variable defines whether the system will e-mail the contacts when the condition is resolved.
At this point NMIS is configured to notify on events, but it is only monitoring the NMIS server itself. I will go through the process of adding nodes to the configuration.
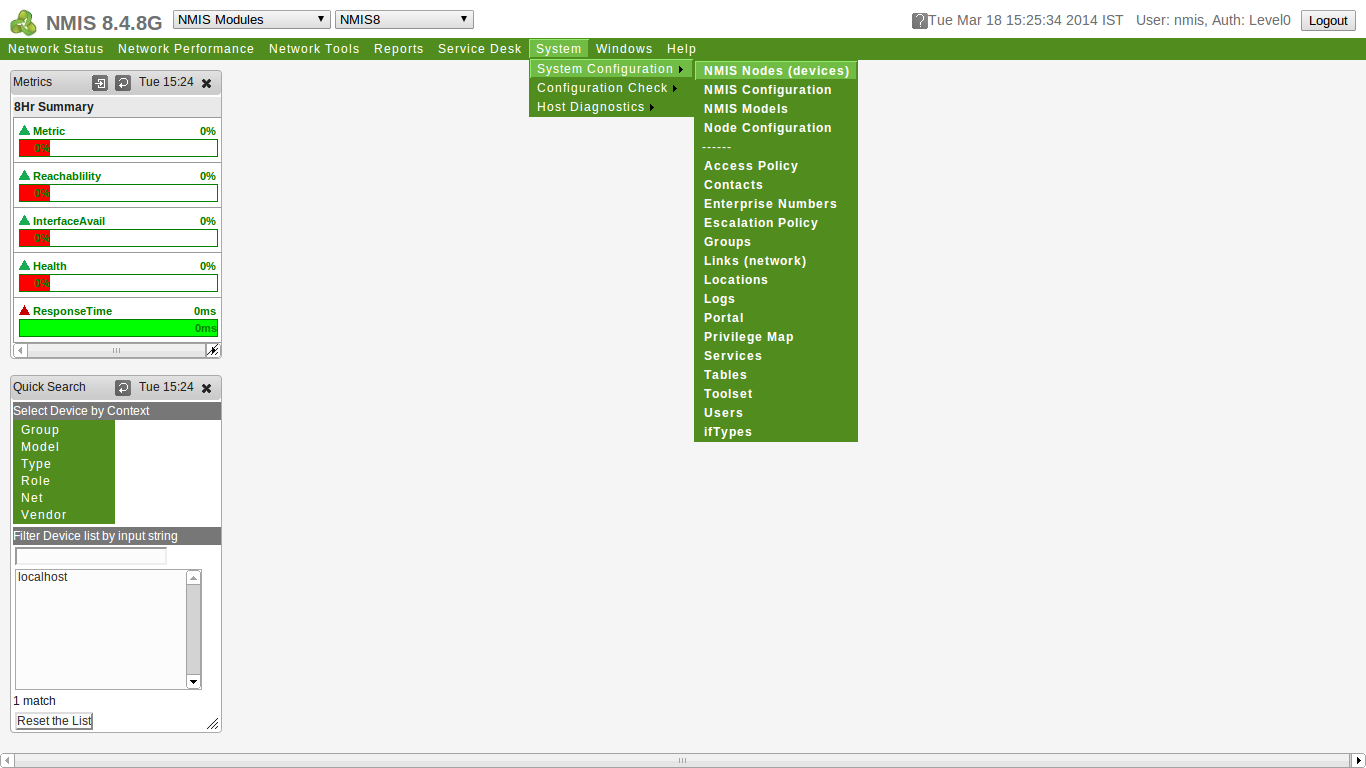
Now I will show how to add network nodes to be monitored by NMIS. First go to System>System Configuration>Nodes.
System>System Configuration>Nodes
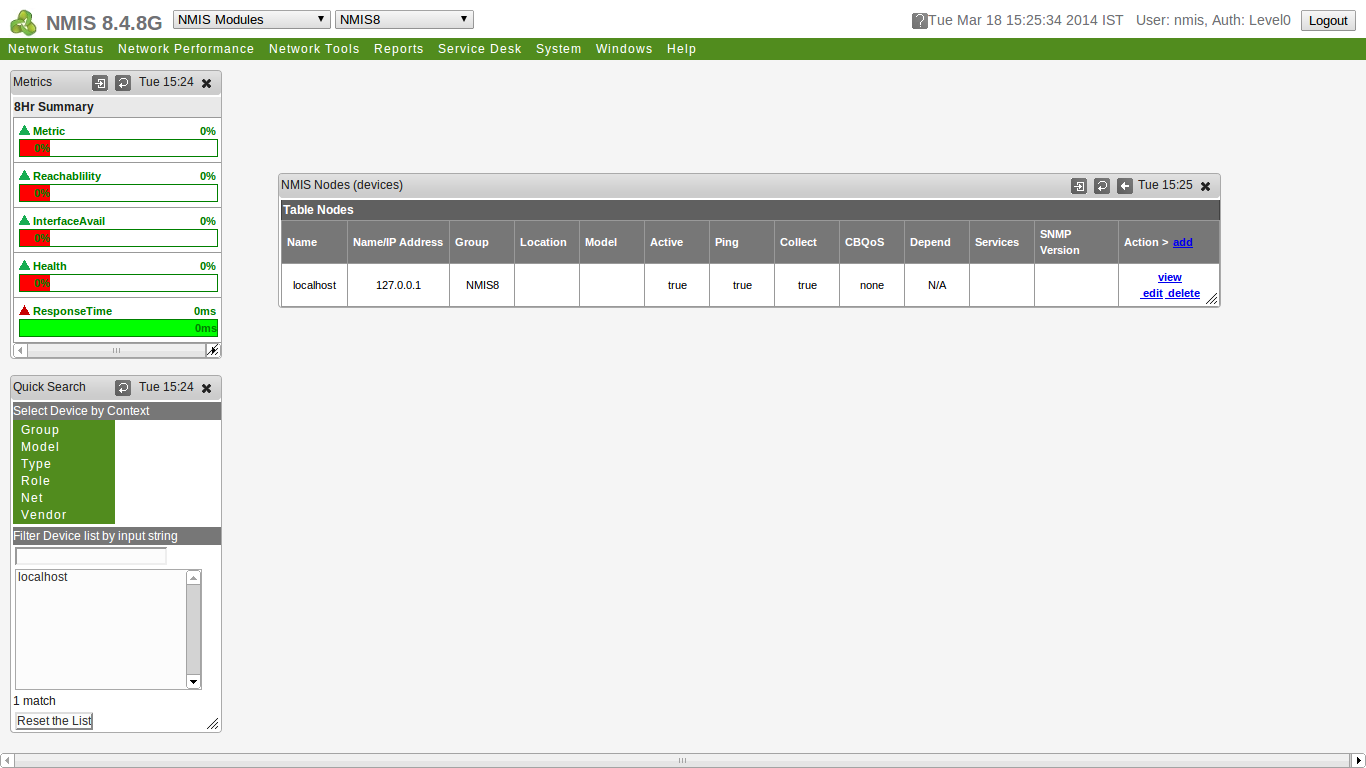
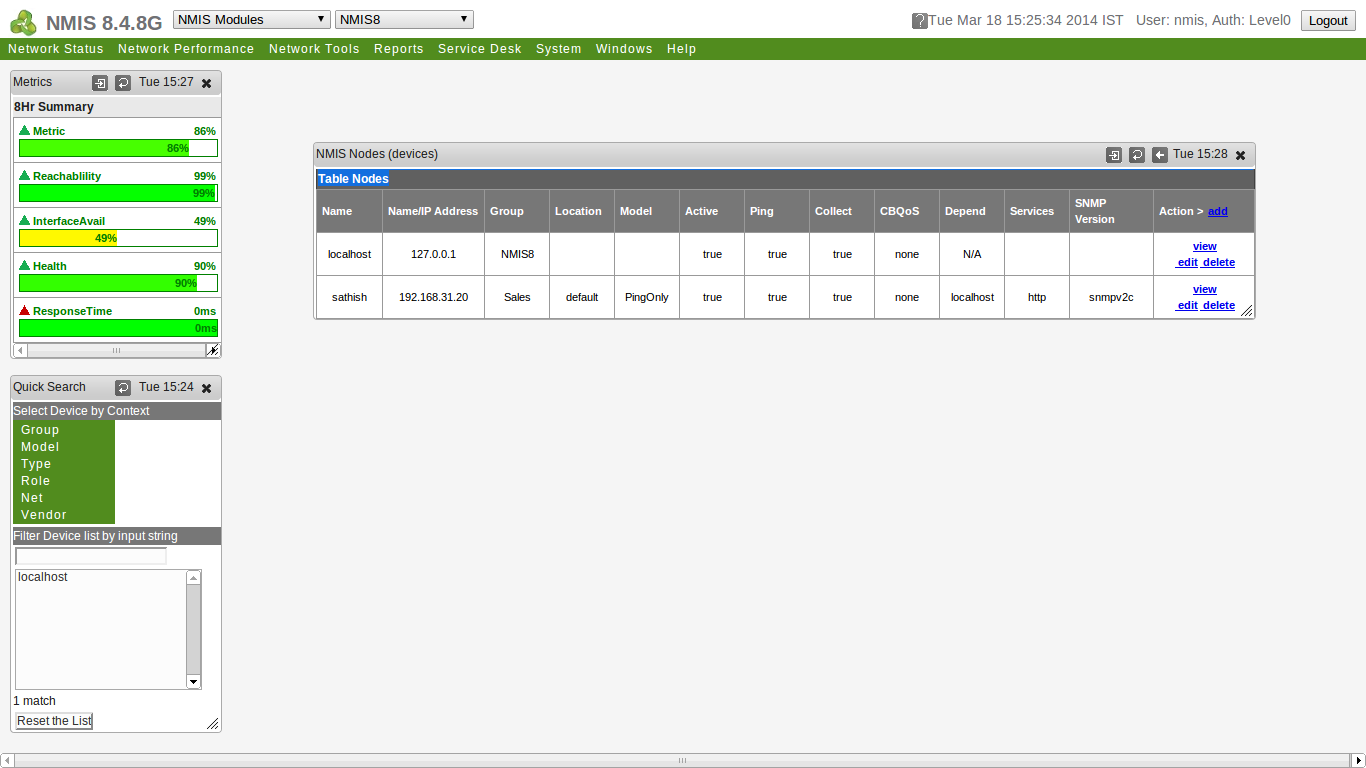
This will bring up the Nodes listing showing currently configured nodes. To add a node, click on add to the right of Action on the top right part of the screen.
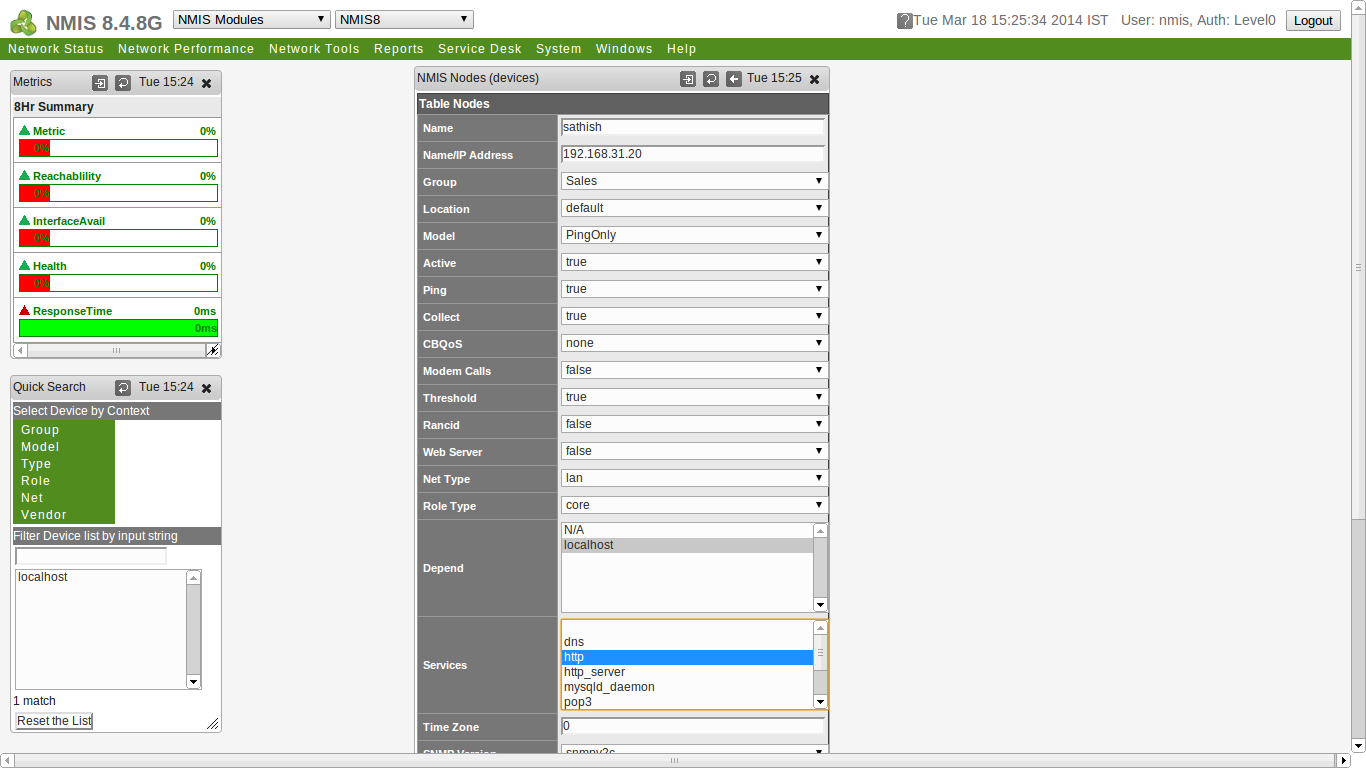
Once you click Add, you will see the add node screen as shown below. There are a lot of variables to configure for each node.
Name: This is the name of the node and should have no spaces in it. This must be unique.
Name/IP Address: This is the IP or the FQDN of the node.
Group: This is the group in which the node will be displayed.
Select Model: This is the data model that NMIS will use to gather SNMP data from the device. In most cases automatic works best.
Active: This defines whether the node is currently actively polled. You can use this set to false to take a group of nodes out of active monitoring without deleting them.
Ping: Should NMIS ping the node for availability?
Collect: Should NMIS collect SNMP data from the node?
CBQoS: Should NMIS collect data about Class Based QoS on inbound, outbound, both or none?
Modem Calls: Should NMIS collect data on modem calls (not used often)?
Threshold: Should NMIS run threshold calculations on this node?
Rancid: Should the Rancid add in add this node to a rancid configuration file? (I’m not sure if this tool is still supported.)
Web Server: Does this device run a webserver?
Net Type: Is this device WAN or LAN?
Role Type: Is the device core, distribution or access?
Depend: What devices must be up for this device to be up? This provides NMIS with a way of knowing when not to alert on a node if an upstream node is down.
Services: Should NMIS check to make sure certain services are running on the node?
Time Zone: What is the time zone offset for the device from GMT?
SNMP Settubgs: What version of SNMP should be used to poll the device and what is the configuration for that version?
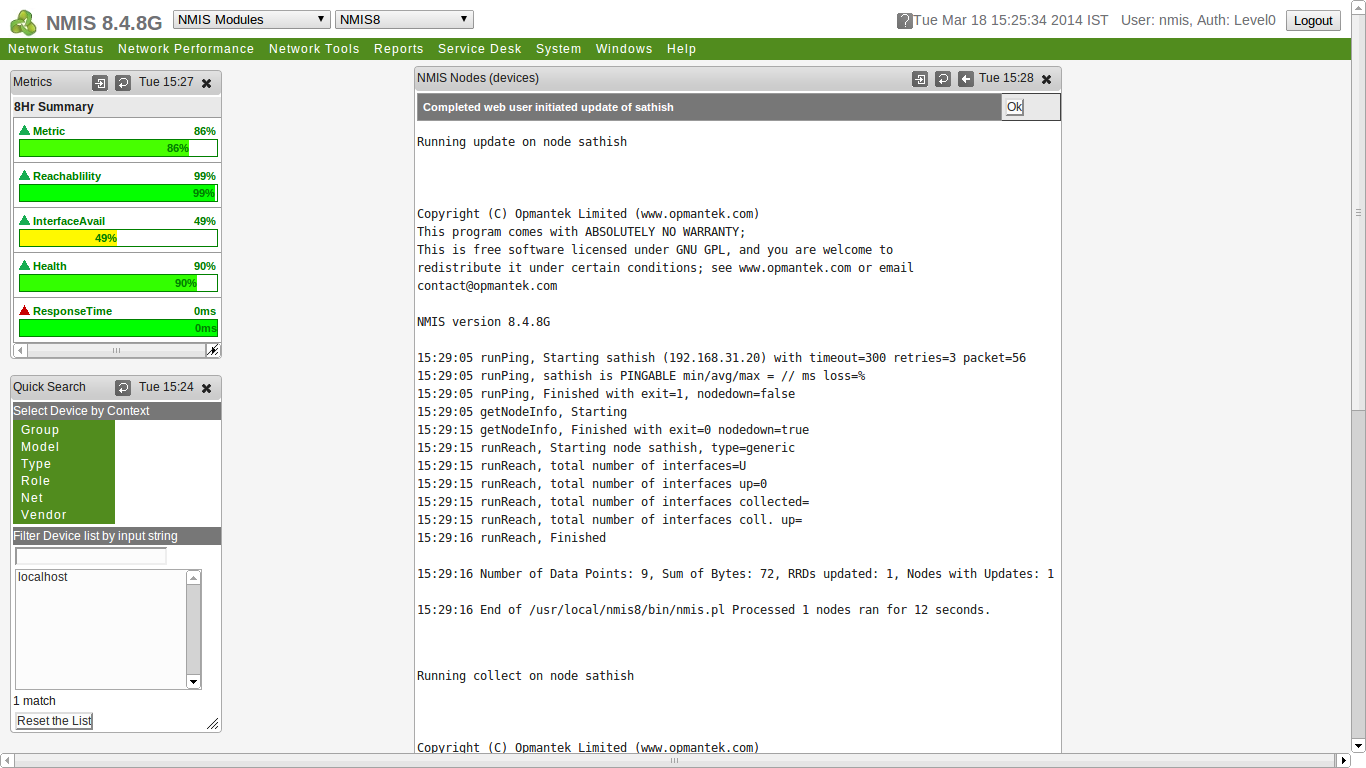
When the configuration is complete, click Add and Update node to add the node to the NMIS configuration and tell NMIS to run an initial scan of the host.
Once the nodes are added, it may take 10-15 minutes for data to start to show up depending on how often the NMIS cron jobs are set to run.
For any doubt follow the documentation of NMIS.


Thanks for the great article.
One question, I’d like to have NMIS 8 use our internal Microsoft Exchange server to send email notifications to our team.
I created a user/mailbox in our Windows domain and I was wondering if there is anything different in the setup, as emails aren’t being delivered.
mail_server: FQDN of our exchange server
mail_domain: mycompany.com
mail_from: NMIS.Notification@mycompany.com
mail_combine: true
mail_password: Windows password for NMIS Notification account
mail_server_port: 465 (left the default)
mail_use_sasl: false
mail_user: NMIS.Notification@mycompany.com – this field’s a bit confusing, so I’m using same email account as mail_from
Thanks!